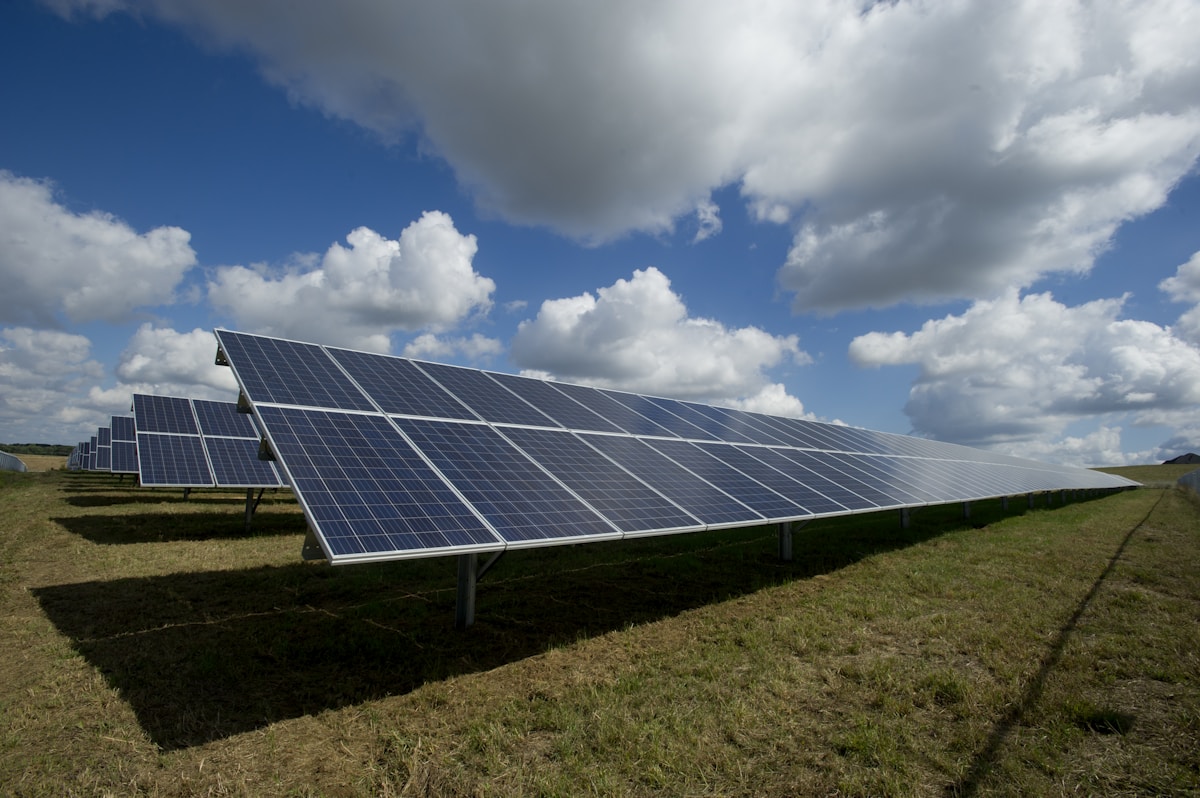
In the spring of 2010, the United States had approximately 2.5 gigawatts of total installed solar capacity — roughly the equivalent of two large natural gas peaker plants. The technology was expensive, deployment was mostly confined to California, and even optimistic forecasts projected that solar would remain a minor contributor to the nation's power mix for decades. Fifteen years later, the U.S. has more than 230 GW of installed solar capacity. The transformation of an entire energy sector, compressed into a single generation, is without modern precedent.
In 2024 alone, according to the U.S. Energy Information Administration, the country added more than 93 gigawatts of new utility-scale solar generation — surpassing natural gas as the single largest source of new capacity additions for the third consecutive year. By any reasonable measure, utility-scale solar is no longer a niche technology or a policy experiment. It is the primary engine of U.S. power sector growth.
The Economics That Changed Everything
The story of solar's rise is, at its core, a story about cost. In 2010, the levelized cost of electricity from a new utility-scale solar installation — the all-in cost per megawatt-hour of generation, accounting for capital, financing, operations, and the variable nature of sunlight — was approximately $350 per megawatt-hour. By 2024, that figure had fallen to somewhere between $28 and $35 per MWh in the most competitive markets, according to Lazard's annual Levelized Cost of Energy Analysis. That is a decline of roughly 90 percent in 14 years.
Cost Decline
~90%
Drop in utility-scale solar LCOE since 2010. New projects now price at $28–$35/MWh in competitive markets — below the operating cost of many existing coal plants.
That cost trajectory has made solar competitive not just against other new generation technologies, but against the operating costs of existing fossil fuel plants. In much of the country, it is now cheaper to build a new solar farm and operate it for 25 years than to simply continue running an existing coal plant. That economic reality is reshaping utility resource planning in ways that were unimaginable a decade ago.
The Inflation Reduction Act of 2022 accelerated that dynamic considerably. The IRA extended and expanded the Investment Tax Credit for solar projects, maintaining a 30 percent federal tax credit through the early 2030s and creating bonus credits — up to an additional 10 percentage points each — for projects that use domestically manufactured components or are sited in energy communities where coal plants have recently closed. For developers who can qualify for multiple adders, effective tax credit rates of 50 percent or higher are achievable. The financial engineering required to monetize these credits has become one of the most active areas of clean energy finance.
Geography of the Surge
Solar deployment is not uniform across the country. Three states — Texas, California, and Florida — account for more than 40 percent of total installed utility-scale solar capacity, and their dominance reflects a combination of solar resources, land availability, electricity market structures, and state-level policy environments that are difficult to replicate elsewhere.
Texas has become the nation's most dynamic solar market, driven by ERCOT's relatively streamlined interconnection process, abundant flat land in West Texas, and the state's competitive wholesale electricity market. Despite having no state-level renewable portfolio standard or explicit clean energy mandate, Texas has added more utility-scale solar capacity in recent years than any other state — a testament to the primacy of economics over policy in large, liquid power markets.
California's trajectory has been different. The state that pioneered U.S. solar policy is now confronting the limits of its own success. With solar providing more than 25 percent of annual in-state generation, California's grid operator, CAISO, has begun curtailing significant volumes of solar output — essentially wasting clean electricity — during periods when supply exceeds transmission capacity or system flexibility. In 2024, CAISO curtailed approximately 2.8 terawatt-hours of solar generation, up from less than 0.5 TWh in 2020. The problem is not that California has too much solar. It is that the grid lacks sufficient storage, flexible demand, and transmission capacity to absorb what the solar fleet produces.
Storage: The Missing Piece, Now Arriving
The California curtailment problem has accelerated the co-location of battery storage with solar projects — a pairing that has become nearly standard in new utility-scale development. Across the country, approximately 80 percent of new solar projects entering the interconnection queue in 2024 included co-located battery storage, according to Lawrence Berkeley National Laboratory data. The batteries serve a dual purpose: they shift solar generation from midday — when it is most abundant and often least valuable — to the evening peak, when demand rises and solar output declines, and they can participate in ancillary services markets, providing additional revenue streams that improve project economics.
The scale of battery storage deployment has followed a cost curve similar to solar itself. Utility-scale lithium-ion battery storage costs have fallen approximately 70 percent since 2015, and the pipeline of new storage projects dwarfs anything contemplated five years ago. ERCOT alone has more than 40 GW of battery storage in its interconnection queue.
"The solar-plus-storage combination is now the default procurement option for utilities in most of the country. It beats gas peakers on cost in virtually every market we analyze." — Senior analyst, BloombergNEF
Permitting: The Remaining Bottleneck
Despite the favorable economics and the surge in development activity, solar deployment continues to face significant permitting constraints — particularly for the largest projects, which often require review under the National Environmental Policy Act and coordination with multiple federal agencies. A utility-scale solar project on federal land in the West can take three to five years to navigate the full permitting process, even when the project itself could be constructed in 12 to 18 months.
Congress has taken several incremental steps to address the permitting bottleneck, including provisions in the Fiscal Responsibility Act of 2023 that established shot clocks for certain federal reviews and streamlined processes for projects with broad interagency overlap. The Biden administration's Bureau of Land Management designated 22 solar energy zones on federal land in the West — areas pre-screened for low environmental conflict — but the supply of available zones in the most attractive locations has become constrained relative to developer demand.
State and local permitting presents a different set of challenges. Opposition to large solar projects — based variously on concerns about land use, visual impact, agricultural displacement, and property values — has grown alongside the industry's scale. Several counties in key solar states have enacted restrictive zoning ordinances that effectively prohibit utility-scale development within their jurisdictions, a trend that has prompted calls for state-level preemption authority similar to what many states already have for natural gas pipelines.
None of these obstacles are likely to stop the solar surge. The economics are too strong, the policy support too durable, and the pipeline too large. But they will shape where solar gets built, how quickly, and at what cost — questions with significant implications for the broader energy transition. The most likely outcome is an industry that continues to grow at a remarkable pace, constrained at the margins by the institutional friction that has always attended large-scale infrastructure development in the United States.